Chapter 4: The most important reports for online stores I
Google Analytics has a lot of different reports and all of them are customizable in many ways. But some reports are of more interest to merchants. These are the reports that can help you guide your business. Who are your customers? Which sources of traffic are generating revenue? What is the return on advertising? What products and categories are your visitors most interested in? Etc. There is lots of detail but what we’re interested in are the most important insights for guiding your business.
How to navigate to specific reports

You will notice below that I have named the reports in a certain way. The name shows you how to navigate to the report. To get to the first report below for example, Conversions > Ecommerce > Overview, click on “Conversions” in the report finder to open up the conversion section. Within that click, on “Ecommerce” and then “Overview”.

In some report names, I have also included “Ecommerce” in parentheses [brackets]. For example, one report is called Traffic Sources > Sources > All Traffic (Ecommerce). To access this report, first of all navigate to Traffic Sources > Sources > All Traffic. Then click on the Ecommerce link underneath the explorer tab (see the screenshot above). This puts the report in ecommerce mode so you can see revenue figures included.
Conversions > Ecommerce > Overview
As I described above, to open this report, open up the conversion section in the report finder. Within that, click on “Ecommerce” and then “Overview”.
This is the key report for ecommerce. It provides statistics for revenue, transactions, products sold, conversion rate, traffic sources, and so much more. Broadly speaking, reports in Google Analytics are structured into three main areas: the graph, the scorecard with key statistics and below that, the data table.
The graph

When you first open this report, the graph shows the ecommerce conversion rate as it varies during the time period selected. The ecommerce conversion rate is the percentage of your store’s visitors that actually make a purchase. In other words, for every one hundred visitors that come to your store, it shows how many of them actually purchase.

You can easily change the graph to look at other metrics (in other words “statistics”) using the metric view selector on the left above the graph. Use the dropdown menu to switch the graph between the metrics: average transaction value, conversion rate, quantity of products sold, revenue, transactions and unique purchases. For me, the most interesting one has always been revenue.

On the right-hand side above the graph, you can choose the level of detail: by hour, day, week or month. Try it out and see how the graph changes.
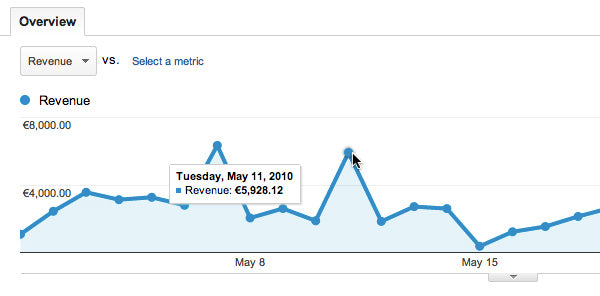
On the graph itself, each time increment is marked by a point. So if you have the graph set to display daily detail, then you will have a point for each day during the period. Placing the mouse near one of the points will display the exact statistic for the day.
The scorecard with key statistics

Below the graph, you’ll see an area marked out with key statistics or metrics: this is called the scorecard. On the ecommerce overview, the scorecard provides statistics for revenue, number of transactions, average order value, quantity of products sold, conversion rate, etc. Each statistic has an accompanying graph showing the variation of the statistic over the time period selected. If you click on one of these small graphs, the main graph will be updated to reflect that statistic.
We'll all be interested in different statistics. For me, the most important ones are revenue, average value and conversion rate. But the others will be of interest in different circumstances.
The data table

Next we get into the more detailed data in the table below the scorecard. On this particular report this area summarizes data from four different reports. For this reason, this area is split in two. On the left-hand side you can select a view: product, product SKU, product category or source/medium. On the right-hand side is the data for the selected view.
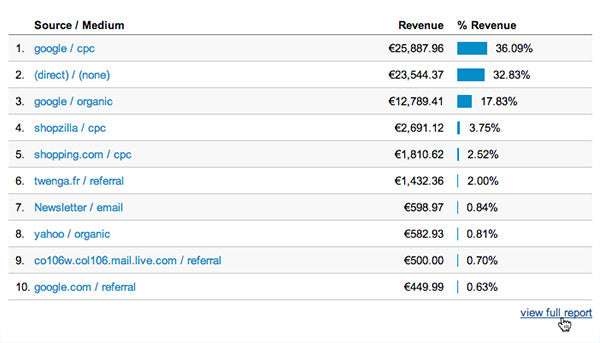
This report shows the product view by default: in other words, the top products sold by quantity. For marketing purposes, the view that’s most interesting to me is the source/medium. This shows the traffic sources that generated the most revenue. The “source” is the website that the visitor clicked from to get to your store: it’s how they found your store. The “medium” is the nature of the link: a click from an organic (i.e. non-paid) result in a search engine; cpc, which stands for cost-per-click advertising; or a referral, which is a link from another website.
Below the table, on the right, you will find a link to view full report. Clicking this will bring you to a report with a much more detailed version of the current view. Before we do that, let’s take a look at how to set things up so you can get to your favorite reports really quickly.
Creating shortcuts to your favorite reports

It’s very simple to create a shortcut to a report you want to be able to access easily. The shortcut will appear in the My Stuff > Shortcuts section of the report finder. The brilliant thing is that shortcuts remember exactly how you customized the report, and that saves you clicks. To create a shortcut for the current report:
- Click on the Shortcut link below the report title. You can see where it is in the screenshot above.
- In the pop-up that appears, enter the name you want to give the shortcut.
- Click OK to save.

The page will refresh and you will notice in the report finder that the shortcuts section is expanded to include a shortcut to the report. There’s also an “Overview” section where you can rename or delete individual shortcuts.
Continue to Chapter 5:The most important reports for online stores (Part II) »